matplotlib —— Python图表绘图

本文最后更新于:2020年9月21日 晚上

概览:matplotlib绘图操作。

导包

1
2
3
4
5
import numpy as np
import pandas as pd
import matplotlib.pyplot as plt
#jupyter中的一个魔法指令
%matplotlib inline

线性图 - plot()

1
2
3
4
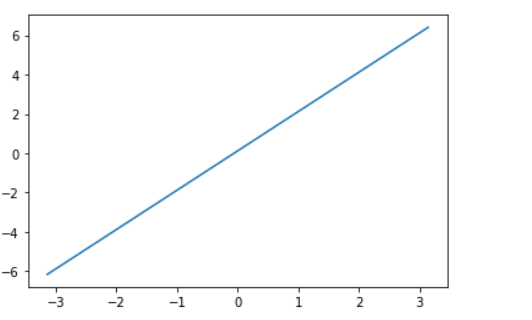
x = np.linspace(-np.pi,np.pi,num=10)
y = 2*x + 0.123

plt.plot(x,y)

在一个坐标系中绘制多条曲线

1
plt.plot(x,y,x+1,y-1) # 直接放多对曲线

或者

1
2
plt.plot(x,y)
plt.plot(x**2,y**0.5)

设置图例

1
2
3
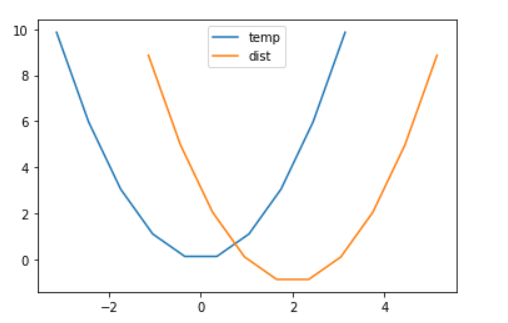
plt.plot(x,y,label='temp')
plt.plot(x+2,y-1,label='dist')
plt.legend(loc=9,ncol=1)

图片保存

1
2
3
4
5
6
7
8
#step1
fig = plt.figure()
#step2:绘图
plt.plot(x,y,label='temp')
plt.plot(x+2,y-1,label='dist')
plt.legend(loc=9,ncol=1)
#step3:保存
fig.savefig('./123.png')

其他

  • plt.figure(figsize=(5,5)) #设置坐标系的比例

柱状图 - bar()

参数:第一个参数是索引。第二个参数是数据值。第三个参数是条形的宽度

1
2
3
x = [1,2,3,4,5]
height = [2,4,6,8,10]
plt.bar(x,height)

直方图 - hist()

  • 是一个特殊的柱状图,又叫做密度图

  • plt.hist()的参数

    • bins
      可以是一个bin数量的整数值,也可以是表示bin的一个序列。默认值为10。即每张图柱子的个数
    • normed
      如果值为True,直方图的值将进行归一化处理,形成概率密度,默认值为False
    • color
      指定直方图的颜色。可以是单一颜色值或颜色的序列。如果指定了多个数据集合,例如DataFrame对象,颜色序列将会设置为相同的顺序。如果未指定,将会使用一个默认的线条颜色
    • orientation
      通过设置orientation为horizontal创建水平直方图。默认值为vertical
1
2
x = [1,1,1,2,3,4,5,5,5,6,7,8,8]
plt.hist(x,bins=15)

饼图 - pie()

1
2
3
4
5
6
7
8
9
10
11
12
13
14
15
16
17
18
19
20
21
22
23
# 1
arr=[11,22,31,15]
plt.pie(arr)

# 2
arr=[0.2,0.3,0.1]
plt.pie(arr)

# 3
arr=[11,22,31,15]
plt.pie(arr,labels=['a','b','c','d'])

# 4
arr=[11,22,31,15]
plt.pie(arr,labels=['a','b','c','d'],labeldistance=0.3)

# 5
arr=[11,22,31,15]
plt.pie(arr,labels=['a','b','c','d'],labeldistance=0.3,autopct='%.6f%%')

# 6
arr=[11,22,31,15]
plt.pie(arr,labels=['a','b','c','d'],labeldistance=0.3,shadow=True,explode=[0.2,0.3,0.2,0.4])

散点图 - scatter()

1
2
3
xx = np.random.random(size=(30,))
yy = np.random.random(size=(30,))
plt.scatter(xx,yy)


本博客所有文章除特别声明外,均采用 CC BY-SA 4.0 协议 ,转载请注明出处!